COVID-19 Pandemic, Real Effective Exchange Rate and Foreign Direct Investment Inflows: Evidence from Morocco, Turkey and Egypt
Ayyoub Ben El Rhadbane1*
Abdeslam El Moudden2
1,2National School of Commerce and Management, University Ibn Tofail, Kenitra, Morocco. |
AbstractThis paper aims to empirically study the impact of real effective exchange rate (REER) volatility in different exchange rate arrangements for the 1990–2020 period and the impact of the Covid-19 pandemic on foreign direct investment (FDI) inflows to Morocco, Turkey and Egypt. Economic growth, gross fixed capital formation, economic openness, and inflation volatility are economic quantities that also specify the model. The autoregressive conditional heteroscedasticity model was used to measure the annual volatility of REER and inflation, and the cointegration bounds test approach via the scaled lag autoregressive model. The estimation results show that FDI inflows responded negatively to real effective exchange rate volatility at the 10% level in Morocco and positively at the 1% level in Turkey at lag (2). In the short run, according to the estimation results obtained, it seems that the Covid-19 pandemic did not have a negative impact on FDI inflows at the 1% level in Morocco, and also did not significantly affect Turkey. In Egypt, the ARDL model was shown to be invalid following the validity tests performed for reasons clarified in this paper. |
Licensed: |
|
Keywords: JEL Classification |
|
Received: 4 March 2022 |
|
| (* Corresponding Author) |
Funding:This study received no specific financial support. |
Competing Interests:The authors declare that they have no competing interests. |
1. Introduction
Foreign direct investment is an opportunity for the host country as well as the investing country. Thanks to this mode of investment, firms will be able to benefit from the economic, fiscal, financial, social and political advantages offered by the host country, along with movements in the exchange rate and production cost terms and consequently gain competitive advantages from a better yield and a strong performance. On the other hand, FDI allows the host country to raise its competitiveness level on a global scale, gain access to the international market, strengthen its knowledge and know-how, take advantage from the transfer of technology, and generate more tax revenue and job opportunities. According to the OECD, FDI reflects the objective of an entity resident in an economy to obtain a lasting interest in an enterprise resident in another economy.
The crucial importance of inward FDI as an engine of growth for the host country has prompted several researchers to study the factors determining the choice of the destination country for direct investment. In fact, there is a general consensus in the literature on the external determinants of the choice of location of multinational firms (Globerman & Shapiro, 1999). According to Mucchielli (1998), four main determinants define the choice of the location of a production unit: the size of the market, the costs of the production factors, the number of local and foreign companies already present, and the different attractiveness policies implemented by local authorities. Thus, the choice of location depends on the combination of the advantages of the firm and the host area (Ferrara & Henriot, 2004).
Referring to the paper examining the determinants of foreign direct investment from Europe to Asia, covering 38 European countries and 24 host Asian countries over the period from 1995–2013, Nguyen & Cieślik (2021) found that market size, skilled labor endowments, investment costs in host countries, trade costs to both source and host countries, bilateral investment treaty, exchange rate volatility, common language, colonial relationship, distance and GDP are correlated to FDI.
In the same framework, through an analysis of the system determinants and transmission mechanisms of the sectoral structure of FDI inflows on a sample of ten Central and East European (CEE) countries from 1995 to 2019, Pečarić, Kusanović, & Jakovac (2021) noted that a developed credit market and the purchasing power of residents led to greater capital inflows into the services sector, while a higher GDP growth rate and a depreciation in the real exchange rate led to higher inflows into the manufacturing sector.
These determinants can attract foreign direct investment with different degrees. Indeed, the exchange rate is one of the determinants that can influence foreign direct investment. This is a very important factor whose impact is not limited to the macroeconomic dimension but also extends to the microeconomic dimension. The exchange rate risk plays a role in the development of SMEs, especially those oriented towards import and/or export activities. The exchange rate risk can slow down an enterprise’s development. Nevertheless, the implementation of the necessary tools and means will not only allow management of this risk but will also improve performance within its sector and ensure continuity.
Furthermore, economics and social crises can also limit FDI inflows. Many studies have investigated the impact of economic crises on foreign direct investments, such as the Asian financial crisis of 1997 and the global financial crisis of 2008 (Dornean, Isan, & Oanea, 2012; Fang, Collins, & Yao, 2021; Xia & Liu, 2021). In this study, the economic and social repercussions caused by the Covid-19 pandemic are examined. There is a consensus that the world’s economy has been severely damaged by the pandemic. The world economic growth was recorded at -3.593% in 2020, worse than that noted in 2009 during the financial crisis (-1.66%).
This paper aims to analyze the impact of some factors considered to be determinants of foreign direct investment inflows according to previous empirical studies while placing more emphasis on the impact of real effective exchange rate volatility from 1990 to 2020 and the impact of the Covid-19 pandemic in the last year on FDI in Morocco, Turkey and Egypt.
According to foreign direct investment statistics published by the United Nations Conference on Trade and Development:
- Between 1990 and 2020, Morocco received the equivalent of $52,695.70 million in foreign direct investment with an annual average of $1,696.83 million. In 2014, Morocco saw the largest inflow of FDI, namely $3,561.24 million, as well as a remarkable drop from $3,558.87 in 2018 to $1,599.13 million in 2019 with a slight increase of 1% in 2020.
- In Turkey, $236,758.00 million of FDI was made between 1990 and 2020 with an annual average of $7,637.35 million. The largest amount of FDI was recorded in 2007 of $22,047 million. FDI in Turkey was down 28% in 2019 and 15% in 2020.
- In Egypt, from 1990 to 2020, $122,280.50 million of foreign direct investment was recorded with an annual average of $3,946.08 million. This country recorded a divestment situation in 2011 amounting to $483 million. Then, in 2012, FDI regained its balance with a figure of $6.031 million following the inflows of funds injected by the Gulf countries into the Egyptian economy. In 2020, FDI inflows marked a significant decrease of 35%.
Figure 1 illustrates the evolution of FDI inflows for Morocco, Turkey and Egypt during the period from 1990 to 2020.
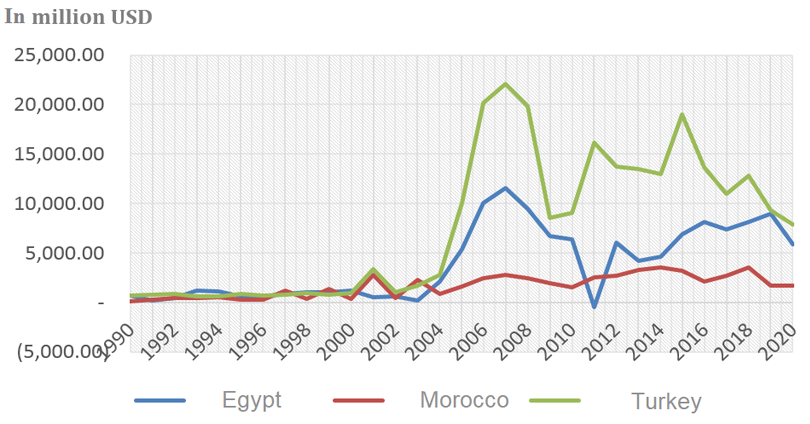
Figure 1. Evolution of FDI inflows between 1990 and 2020: Morocco, Turkey and Egypt.
This study examines the impact of REER volatility in different exchange rate arrangements, and Covid-19 pandemic on inward FDI in the three countries mentioned above. The second section presents the theoretical framework and the literature review. The third section presents the data and the methodology. The fourth and fifth sections contain the results and the conclusion, respectively.
2. Theoretical Framework and Literature Review
2.1. Theoretical Framework
Theoretically speaking, the relationship between foreign direct investment inflows and exchange rate, or the Covid-19 pandemic, can fit into the theoretical framework of "investing in the context of uncertainty". In other words, the impact that an uncertain situation can have on investment (Dixit & Pindyck, 1994).
Several authors have analyzed the relationship between investment and uncertainty. Lucas (1967) found a negative impact of uncertainty on investment and showed that uncertainty reduces investment in the presence of costs of adjustment or when there is irreversibility in the investment process (Nickell, 1974). Other authors have pointed out the positive impacts of uncertainty on investment (Hartman, 1972; Abel, 1983).
2.2. Literature Review
The positive aspects of inward FDI for host countries encourage states to focus more on the determinants of FDI and use them effectively to attract more investment in the national economy and strengthen the economic fabric. In this sense, the exchange rate and socioeconomic world crises remain crucial elements to be taken into consideration by a foreign investor, in particular a multinational. Several previous studies have examined the relationship of the real effective exchange rate with foreign direct investment inflow. These researchers analyzed the impact of the exchange rate and its volatility on inward FDI. Some studies focus on a specific country, region or economic union, or on a specific industry, or combine the two simultaneously.
2.2.1. Exchange Rate and FDI Inflows
According to his study of the relationship of the exchange rate to FDI, Caves (1982) stated that the appreciation of the US dollar stimulated foreign direct investment by American companies in Europe. Barrell & Pain (1996) supported this conclusion by stating that the appreciation of the exchange rate increases direct investment to minimize production costs. The same relationship has been confirmed by Klein & Rosengren (1994), who analyzed FDI from Canada, Japan and several European countries to the United States from 1979 to 1991, and Sazanami & Wong (1997); Bayoumi & Lipworth (1998); Ito (2000); and Sazanami, Yoshimura, & Kiyota (2003), who examined the effects of the exchange rate on Japanese FDI for different periods.
In a study examining the impact of exchange rate and exchange rate volatility, openness level, wages, literacy level and tax on foreign direct investment inflow to Mauritius with a dynamic time series approach covering the period from 1976 to 2018, Warren, Seetanah, & Sookia (2021) found that exchange rate volatility is negatively correlated to FDI, while a depreciating real exchange rate attracts foreign investors.
In Asia, Baek & Okawa (2001) found that a depreciation of Asian currencies against the dollar significantly increased FDI in key export sectors, such as machinery, chemical and electrical sectors. In particular, Japanese FDI in electrical machinery is the most export-oriented sector where more than 70% of total sales in this industry were destined for export in Asian currencies against the dollar, which makes the products in the electrical industry export oriented. The machinery sector is more competitive in international trade and thus increases FDI in these countries as a production site for exports. Also, Takagi & Shi (2011) analyzed the relationship between the exchange rate and Japanese FDI in nine Asian countries for the period from 1987 to 2008 and saw a sharp increase in FDI inflows from Japan to affected countries due to the depreciation of the host country's currency. Dees (1998) found a negative effect of the real exchange rate on FDI in China. Empirical results indicate that the decline in China's real exchange rate was associated with the increase in the stock of FDI. Using data from 18 countries between 1989 and 2006, Liu (2010) found that the real exchange rate depreciation had a positive relationship with FDI inflows into China. The study by Thomas & Grosse (2001) on inward FDI to Mexico from 1980 to 1995 also showed that firms in a country with a higher real exchange rate were more likely to invest in Mexico. Sridharan, Vijayakumar, & Rao (2010) also showed a significant negative relationship between FDI and the real exchange rate using annual observations from 1975 to 2007 for five rapidly developing countries, namely Brazil, Russia, India, China and South Africa.
Froot & Stein (1991) studied the impact of real exchange rate on FDI from industrialized countries to the United States using annual data covering the period from 1974 to 1987. Distributing the overall FDI inflows across 13 separate industries, they found that all 13 exchange rate coefficients showed negative signs, indicating that the depreciation led to an increase in FDI, and five of the coefficients were statistically significant. This result was confirmed by Pečarić et al. (2021), who found that a depreciated real exchange rate led to higher inflows into the manufacturing sector in the Central and East European Countries. Sazanami et al. (2003) examined Japan's FDI at the industry level from 1978 to 1999, focusing on four machine industries; their study found that real exchange rate had stronger impacts on FDI in the electronics and general machinery industries than in the precision or transportation industries. So, the studies by Froot & Stein (1991)and Sazanami et al. (2003) showed that the size of the effect of the real exchange rate on FDI differs from one industry to another.2.2.2. Exchange Rate Volatility and FDI Inflows
In addition, regarding the effect of the exchange rate volatility of host countries with the entry of FDI, Cushman (1985), Cushman (1988), and Goldberg & Kolstad (1995) also confirmed the positive effects of the volatility of exchange rate on FDI. Cushman (1985) investigated FDI from the United States to Canada, France, Germany, Japan and the United Kingdom between 1963 and 1978, while Cushman (1988)analyzed FDI from Canada, France, Germany, Japan and the United Kingdom to the United States between 1963 and 1986. These analyses showed that all the estimated coefficients of exchange rate volatility had a positive impact on the exchange rate on entry of the of foreign direct investment (FDI). Goldberg & Kolstad (1995) examined the impact of exchange rate volatility on bilateral FDI from Canada, Japan and the United Kingdom to the United States for the period from 1978 to 1999 using quarterly data and found a positive and statistically significant impact of exchange rate volatility on FDI. Takagi & Shi (2011) analyzed the relationship between the exchange rate and Japanese FDI for nine Asian countries from 1987 to 2008 and found that an increase in the exchange rate volatility also favors FDI inflows. This finding indicates that this is a substitution of FDI for exports in these countries. However, Pečarić et al. (2021) found that exchange rate volatility has a negative and highly statistically significant impact only on host countries without a floating exchange rate regime. Nguyen & Cieślik (2021) confirmed that exchange rate volatility is negatively correlated to FDI from Europe to Asia.
However, exchange rate volatility may also incite investors to postpone their decision to invest abroad. An increase in volatility lowers investors optimistic expectations for the host country's economy because of the risks associated with the expected returns on investments (Cushman, 1985). Several researchers have shown that foreign investors postpone or reduce their investment decisions in the event of exchange rate volatility(Campa, 1993; Dixit, 1989; Kiyota & Urata, 2004).
Bénassy-Quéré, Fontagné, & Lahrèche-Révil (2001), through their analyses on the exchange rate and its volatility, found that volatility increases inward FDI, and a depreciation of the host country's currency increases the stock of FDI. The study of the effects of exchange rate volatility, assessed by the coefficient of variation of the nominal quarterly exchange rate over the past three years on FDI from 17 OECD countries to 42 countries from 1984 to 1996 using annual data, allowed Bénassy-Quéré et al. (2001) to find that the high volatility of exchange rate discouraged FDI, while the depreciation of the local currency encouraged FDI. Similarly, by analyzing data from a panel of firms covering the period from 1980 to 1994 for 117 countries from four manufacturing industries in Japan, Urata & Kawai (2000) found that the high volatility of the exchange rate was discouraging FDI, while the depreciation of the host country's currency increased Japanese FDI.
2.2.3. Covid-19 Pandemic and FDI Inflows
The year 2020 has seen one of the most drastic crises in the last 100 years. The Covid-19 pandemic resulted in a socioeconomic crisis impacting all macroeconomic indicators. According to the United Nations Conference on Trade and Development, global FDI dropped by 35% from $1.5 trillion in 2019 to $1 trillion in 2020. This is less than the damage caused by the financial crisis of 2008, which saw a decline of almost 18% in inward FDI (World Investment Report, UNCTAD).
The economic crisis due to the Covid-19 pandemic is considered more serious than past economic crises, such as the crises of 1929 (crash of 1929), 1971 (inconvertibility of the US dollar), 1997 (Asian economic crisis) and 2008 (subprime crisis). It created a widespread crisis of supply and demand due to the disturbance of the production chains and the drops in consumption following the imposed lockdowns.
FDI recorded the most significant drop, with 58% in developed countries, and 8% in developing countries. According to statistics published by UNCTAD, the FDI flows to the Asian continent increased by 4% in 2020 and decreased for the European Union, North America, South-Central America and Africa by 73%, 42%, 84% and 16% -16%, respectively, compared to 2019.
2.2.3.1. Geographical Representation of FDI Inflows on the Brink of the Health Crisis
- On the American continent, the United States of America (-40%), Canada (-50%), Brazil (-164%) and Panama (-633%) recorded a significant drop of FDI inflows, unlike Uruguay’s FDI, which increased by 30% in 2020.
- The European Union FDI decreased by 73% in 2020 recording drops in the Netherlands (-335%), Italy (-102%), France (-47%) and Germany (-34%), but recorded rises in Luxembourg (320%), Spain (5%), Sweden (158%) and Belgium (192%).
- In 2020, the African continent recorded a slight drop of FDI inflows. Nigeria, Morocco and Senegal saw their FDI increase by 3%, 3% and 39%, respectively. On the other side, Egyptian, Tunisian and South African FDI decreased by 35%, 39% and 23%, respectively.
- The Asian continent saw its FDI inflows increase by 4%. Malaysian, Singaporean and Turkish FDI reduced by 55%, 21% and 15%, respectively, unlike India (24%), Saudi Arabia (20%), the United Arab Emirates (11%) and China (6%), which recorded rises in FDI.
It is clear that the Asian continent is the only one to record an increase in inward FDI. This can be explained by the fact that the countries of this continent have not been strongly impacted by the repercussions of the Covid-19 pandemic compared to those of the European continent. China, having declared the first case of the Covid-19 virus, was the first country officially released from the health emergency.
Fang et al. (2021) studied the impact of Covid-19 on FDI using quarterly data on 43 countries in 2009Q1–2020Q3 and found that the numbers of new deaths, new cases, and cumulative cases all have significant and negative impacts on FDI, with elasticities of -7.6 %, -6.6 % and -8.9 %, respectively. The pandemic appeared to have significantly slowed down cross-border FDI in the first three quarters of 2020.
According to their study on four different datasets, including their own survey in mid-2020 and analyzing how China’s investments in Germany have developed over time and the potential impact of the Covid-19 pandemic, Xia & Liu (2021) found that Chinese investments in Germany have not been strongly impacted by the Covid-19 pandemic and that any negative impact is expected to be short-lived.
It seems that the Covid-19 pandemic did not have the same impact on inward FDI in all countries. In this paper, we analyze of the impact of the REER and the effect exerted by the Covid-19 pandemic on FDI flows to Morocco, Egypt and Turkey.
3. Data and Methodology
3.1. The Data
In order to examine the impact of real effective exchange rate and the socio-economic crisis due to the Covid-19 pandemic on FDI inflows, we use a data panel made up of seven variables, namely foreign direct investment inflows, economic growth, gross fixed capital formation, economic openness, real effective exchange rate volatility, inflation volatility, and the Covid-19 pandemic as a dummy variable. This paper examines the impact of REER volatility in the short and long terms, and the Covid-19 pandemic in the short term, on foreign direct investment inflows.
This empirical study uses data from the World Bank, the United Nations Conference on Trade and Development, and the Bruegel REER database. Table 1 presents economic quantities that specify our model and the data sources for each variable.
| Variables | Sources |
| Foreign Direct Investment inflows (FDI) | United Nations Conference on Trade and Development |
| Economic Growth (GDP) | World Bank |
| Gross Fixed Capital Formation (GFCF) | World Bank |
| Economic Openness (OP) | World Bank |
| Inflation Volatility (Volinf) | World Bank and the authors’ own calculations |
| Real Effective Exchange Rate Volatility (VolREER) | Bruegel REER database (September 13, 2021) and the authors’ own calculations |
| Covid-19 pandemic | Dummy variable |
The choice of the econometric study’s period (1990–2020) and its periodicity is due to the following two elements:
- Data availability.
- This period saw economic, fiscal and exchange rate policy reforms in the three countries studied. These reforms appear as reactions to economic crises that have affected these three economies in order to restore their macroeconomic equilibrium without forgetting the economic crisis of 2020 due to the repercussions of the pandemic.
3.2. Definition of Variables
3.2.1. Dependent Variable
Foreign direct investment inflows continue to be a key factor in the economic, social, and technological development of countries. This encourages the continued interest of researchers in this variable, its evolution and its determinants. In our case, foreign direct investment inflow is the endogenous variable. It refers to the flow of direct investment equity into the reporting economy and is the sum of equity, reinvestment of earnings and other capital.
3.2.2. The Main Exogenous Variables
This study examines the impact of the volatility of the real effective exchange rate and the Covid-19 pandemic on FDI inflows. The real effective exchange rate and/or its volatility have been, and still are, the subject of several studies and are considered determining factors of foreign direct investments inflows.
The unprecedented economic and social effects of the Covid-19 pandemic have prompted several researchers around the world to examine the repercussions of this health crisis on different industries and macroeconomic indicators.
In this study, we use the annual average of the monthly volatility values of the real effective exchange rate from the ARCH-GARCH model, and the dummy variable takes the value of 0 or 1 to indicate the absence or presence, respectively, of the Covid-19 pandemic. It should be noted that in our case this dummy variable takes the value of 1 only in the year 2020 given that the first case reported in the city of Wuhan was dated November 17, 2019, and the economic and social consequences of this crisis did not occur until 2020.
3.2.3. Control Variables
The control variables used in this study are inflation volatility, economic growth, gross fixed capital formation and trade openness. The choice of these control variables is based on several previous studies.
- Economic growth represents annual growth rate as a percentage of economic growth (GDP) at market prices based on a constant local currency. Aggregates are based on constant 2010 US dollars.
- Gross fixed capital formation (GFCF) includes land improvements (fences, ditches, drains, etc.); the purchase of plant machinery and equipment; and the construction of roads, railways, schools, offices, hospitals, private residential dwellings, and commercial and industrial buildings.
- The degree of economic openness (OP) is measured by the sum of exported and imported goods and services measured as a percentage of gross domestic product.
- Inflation volatility is the annual average of the monthly volatility values of the inflation rate from the ARCH-GARCH modelling.
3.3. Methodology
At this level, the choice of techniques used to accomplish our econometric study to examine the impact of REER volatility and the Covid-19 pandemic, and to properly specify our ARDL model, was based on the previous studies carried out in this context. As a result of that, we follow the steps below to specify our model:
- First step: measure the volatility of real effective exchange rate and inflation rate (volatility measuring).
| Countries | 1 |
2 |
3 |
|||||||
AIC |
SIC |
HQC |
AIC |
SIC |
HQC |
AIC |
SIC |
HQC |
||
| LogInf | ||||||||||
| Morocco | 0.21* |
0.23* |
0.22* |
0.22 |
0.25 |
0.23 |
0.22 |
0.26 |
0.24 |
|
| Turkey | -1.82 |
-1.80 |
-1.81 |
-1.89* |
-1.86* |
-1.88* |
-1.89 |
-1.85 |
-1.87 |
|
| Egypt | -0.72* |
-0.70* |
-0.71* |
-0.72 |
-0.69 |
-0.71 |
-0.72 |
-0.67 |
-0.70 |
|
| LogREER | ||||||||||
| Morocco | -6.29* |
-6.27* |
-6.28* |
-6.29 |
-6.26 |
-6.28 |
-6.28 |
-6.26 |
-6.27 |
|
| Turkey | -3.57 |
-3.55 |
-3.56 |
-3.64 |
-3.62 |
-3.63 |
-3.65* |
-3.62* |
-3.64* |
|
| Egypt | -3.06* |
-3.04* |
-3.05* |
-3.06 |
-3.04 |
-3.05 |
-3.06 |
-3.03 |
-3.04 |
|
Note: * represents statistical significance at 1%. |
Table 2 shows that the optimal degrees of delay for Morocco, Egypt and Turkey are 1, 2 and 1, respectively, for the LogInf variable. Regarding the logREER variable, the degrees of delay are in the same order (1, 3 and 1).
The heteroscedasticity test was then applied to check the for presence of an arch effect on each variable (REER and inflation rate) for each country. The results listed in Table 3 confirm the presence of an arch effect for all three countries.
| Countries | Morocco |
Turkey |
Egypt |
| LogInf | 0.000 (1) |
0.0726 (1) |
0.0078 (1) |
| LogREER | 0.0374 (1) |
0.0000 (1) |
0.0385 (7) |
Finally, to measure volatilities of real effective exchange rate and inflation rate, we use the ARCH and its generalization GARCH models. ARCH (autoregressive conditional heteroscedasticity) models are used to characterize and model time series. They are widely used in the modeling of time series that have varying volatilities, and the equation is given as:
ARCH model
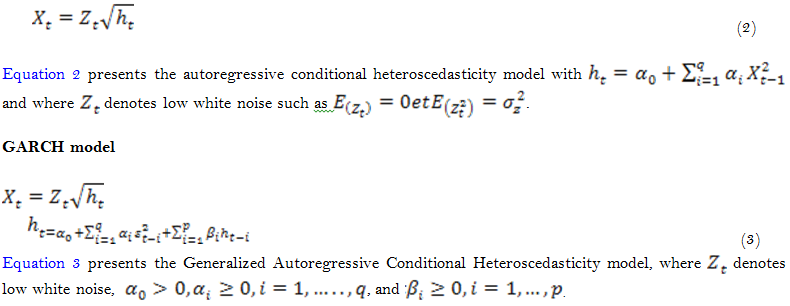
Table 4 exhibits the results of the GARCH(1,1) order modeling. The GARCH(1,1) estimates illustrate that the parameter coefficients of the equation of variance are significantly different from zero and that the coefficients of the equation of variance satisfy the constraints that ensure the positivity of the variance. For this, we use the GARCH(1,1) model.
| Variable | Country | Log-Inflation |
||
RESID (-1) ^2 |
GARCH (-1) |
Adj. R2 |
||
| LogInf | Morocco | 0.32 (0.0000) |
0.52 (0.0000) |
0.72 |
| Turkey | 0.05 (0.0028) |
0.79 (0.0000) |
0.99 |
|
| Egypt | 0.04 (0.0016) |
0.91 (0.0000) |
0.94 |
|
| LogREER | Morocco | 0.16 (0.0000) |
0.06 (0.0052) |
0.93 |
| Turkey | 0.21 (0.0001) |
0.54 (0.0000) |
0.96 |
|
| Egypt | 1.008 (0.0000) |
0.54 (0.0000) |
0.94 |
|
The GARCH(1,1) model measures the monthly volatility of the inflation rate and the real effective exchange rate for Morocco, Turkey and Egypt. The annual volatility for country "i" in year "t" is the average of the twelve months (January to December) of the monthly volatilities, and its equation is given as:
Equation 4 shows how annual volatility is calculated, where ‘t’ represents the year, ‘i’ is the country, and ‘k’ is the month with (k = 1, January, ...... k = 12, December).
- Second step: test for multicollinearity
This test verifies the presence of an intercorrelation between the independent variables. Indeed, the existence of a large, albeit imperfect, linear relationship between two or more regressors is likely to give rise to more subtle statistical problems. To do this, we carry out a multicollinearity test between the variables of each model using the variance inflation factor (VIF).
Table 5 shows that the annual volatility of the REER and inflation in Turkey and the sum of imported and exported goods and services (as a % of GDP) in Morocco expressed in logarithm form, pose a problem of moderate multicollinearity with a VIF value greater than 5. To remedy this multicollinearity, the following was considered:
- For Morocco: substitute the sum of imported and exported goods and services (as a % of GDP) expressed in logarithm form by the sum of imported and exported of goods and services (in dollars) expressed in logarithm form.
For Turkey: replace the annual volatility of the inflation rate and the REER expressed in logarithm form by the originals values of annual volatility of the inflation rate and the REER without logarithm.
| Countries | LvolREER |
LvolInf |
GDP |
LOP |
LGFCF |
Covid-19 |
| Morocco | 1.59 |
2.37 |
1.31 |
5.70 |
4.37 |
1.48 |
| Turkey | 5.08 |
7.51 |
1.29 |
2.03 |
1.97 |
1.38 |
| Egypt | 3.00 |
1.25 |
1.31 |
4.62 |
1.66 |
1.09 |
After applying the above changes, Table 6 confirms that the VIF values corresponding to the annual volatility of the REER in Turkey and the sum of imported and exported goods and services (as a % of GDP) in Morocco become less than 5.
| Countries | VolREER |
VolInf |
GDP |
LOP |
LGFCF |
Covid-19 |
| Morocco | 1.53** |
2.40** |
1.32 |
4.25 |
3.15 |
1.36 |
| Turkey | 3.62 |
4.62 |
1.25 |
1.86 |
1.68 |
1.43 |
Note: ** Expressed in log form. |
- Third step: check the stationarity of the time series
Before proceeding to the analysis of the ARDL model for each country, it is necessary to verify the stationarity of each of the independent variables. To do this, we used the one most widespread categories of tests, which are still used today, namely the augmented Dickey–Fuller test (ADF) whose null hypothesis is no stationarity.
Augmented Dickey–Fuller Test
With:
H0: a unit root is present in a time series sample.
Equation 5 presents the augmented Dickey–Fuller, where α represents the constant, ![]() represents the trend,
represents the trend, ![]() and
and ![]() are the lag 1 of time series and the first difference of the series at time (t-1), respectively, and
are the lag 1 of time series and the first difference of the series at time (t-1), respectively, and ![]() represents the error term.
represents the error term.
The ADF test results in Table 7 indicate that all variables seem stationary at level or at first difference for each of the three countries. Therefore, we can use the ARDL model once all variables are stationary at level or at first difference.
| Pays | Morocco |
Turkey |
Egypt |
|||
| Variable | At level |
At first difference |
At level |
At first difference |
At level |
At first difference |
| GDP | -8.99*** |
-8.70*** |
-5.60*** |
-5.60*** |
-4.07** |
-7.75*** |
| FDI | 1.24 |
-16.45*** |
0.81 |
-5.41*** |
-5.51*** |
-8.85*** |
| LGFCF | 0.06 |
-4.91*** |
-2.0267 |
-5.74*** |
-0.82 |
-4.19*** |
| LVOLINF | -4.16** |
-11.09*** |
-3.83*** |
-4.98*** |
-1.01 |
-5.25*** |
| LVOLREER | 0.79 |
- 4.70*** |
-0.38 |
-6.72*** |
-0.23 |
-5.58*** |
| LOP | 1.4580 |
-4.38** |
-5.09*** |
-3.90** |
-4.47*** |
-4.00*** |
Note: *** and ** represent statistical significance at 1% and 5%, respectively. |
- Fourth step: ARDL model specification
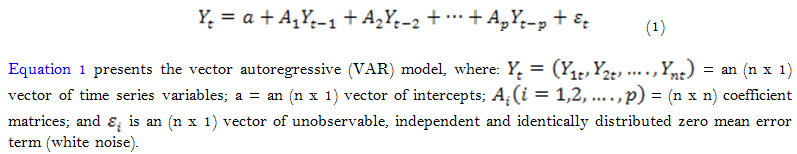
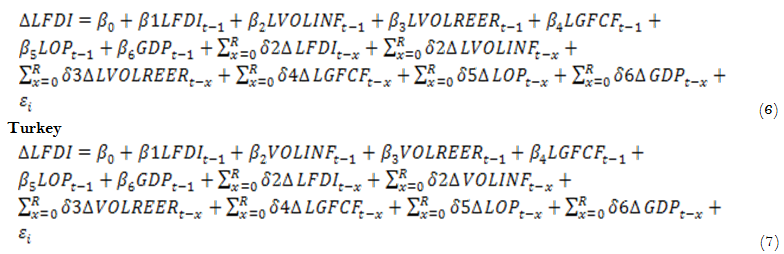
To examine the impact of REER volatility and the Covid-19 pandemic on FDI inflows, we chose the cointegration bounds test approach via the scaled lag autoregressive (ARDL) model. ARDL models have come to play an important role in the modelling of non-stationary time series data. In particular, they are used to implement the so-called "bounds tests" (Pesaran & Shin, 1999; Pesaran, Shin, & Smith, 2001) to see if long-run relationships are present when we have a group of time series, some of which may be stationary, while others may not. In our case, the ARDL model is presented as follows:
Morocco and Egypt
4. Results and Discussion
4.1. Regression Results
Following the ARDL model, we obtain the results shown in Tables 8 and 9, which present the short- and long-term estimates of FDI inflows, respectively, for Morocco, Turkey and Egypt. It should be remembered that the volatilities of the real effective exchange rate and of inflation, economic growth, gross fixed capital formation, economic openness, and the Covid-19 pandemic as a dummy variable constitute the explanatory variables for the entry of foreign direct investment.
| Variable | Morocco |
Turkey |
Egypt |
||||||
Coeff. |
Std. error |
t-stat (Prob) |
Coeff. |
Std. error |
t-stat (Prob) |
Coeff. |
Std. error |
t-stat (Prob) |
|
| D(LFDI(-1)) | 0.34 |
0.08 |
4.06*** |
0.50 |
0.08 |
5.56*** |
0.43 |
0.09 |
4.81** |
| D(LFDI(-2)) | 0.53 |
0.05 |
10.05*** |
__ |
__ |
__ |
__ |
__ |
__ |
| D(GDP) | 0.06 |
0.00 |
20.02*** |
-0.005 |
0.00 |
-0.91 |
0.51 |
0.28 |
1.79 |
| D(GDP(-1)) | 0.01 |
0.00 |
4.55*** |
0.01 |
0.00 |
3.01** |
1.37 |
0.338 |
4.07** |
| D(GDP(-2)) | __ |
__ |
__ |
__ |
__ |
__ |
1.69 |
0.34 |
4.97** |
| D(LGFCF) | 5.08 |
0.51 |
9.96*** |
-0.11 |
0.78 |
-0.14 |
0.27 |
0.23 |
1.15 |
| D(LGFCF(-1)) | -10.22 |
0.66 |
-15.36*** |
__ |
__ |
__ |
__ |
__ |
__ |
| D(LOP) | 1.05 |
0.17 |
6.16*** |
__ |
__ |
__ |
-0.08 |
0.09 |
-0.86 |
| D(LOP(-1)) | 6.67 |
0.43 |
15.28*** |
__ |
__ |
__ |
0.04 |
0.08 |
0.56 |
| D(LOP(-2)) | 2.21 |
0.39 |
5.53*** |
__ |
__ |
__ |
0.64 |
0.06 |
9.87*** |
| D(LVOLINF) | -0.56 |
0.03 |
-14.54*** |
-0.003 |
0.00 |
-1.86* |
2.95 |
0.84 |
3.48** |
| D(LVOLINF(-1)) | 0.23 |
0.04 |
5.74*** |
0.01 |
0.00 |
5.11*** |
3.64 |
0.85 |
4.26** |
| D(LVOLINF(-2)) | 0.42 |
0.03 |
12.04*** |
__ |
__ |
__ |
__ |
__ |
__ |
| D(LVOLREER) | 9.34 |
0.67 |
13.78*** |
0.019 |
0.00 |
5.55*** |
5.38 |
3.30 |
1.62 |
| D(LVOLVREER(-1)) | 3.79 |
0.73 |
5.18*** |
0.007 |
0.00 |
2.36** |
-19.16 |
5.33 |
-3.58** |
| D(LVOLVREER(-2)) | __ |
__ |
__ |
__ |
__ |
__ |
__ |
__ |
__ |
| Covid-19 | 2.31 |
0.14 |
16.50*** |
0.12 |
0.09 |
1.34 |
4.93 |
1.82 |
2.70** |
| CointEq(-1) | -2.16 |
0.11 |
-18.46*** |
-1.50 |
0.13 |
-11.37*** |
-1.82 |
0.13 |
-13.37*** |
| R-squared | 0.99 |
__ |
__ |
0.89 |
__ |
__ |
0.96 |
__ |
__ |
| Adjusted R-squared | 0.98 |
__ |
__ |
0.85 |
__ |
__ |
0.93 |
__ |
__ |
| S.E. of regression | 0.03 |
__ |
__ |
0.08 |
__ |
__ |
1.31 |
__ |
__ |
| F-Bounds Test | 24.34 |
__ |
(0.000) |
12.64 |
__ |
(0.000) |
14.59 |
__ |
(0.000) |
Note: ***, ** and * represent statistical significance at 10%, 5% and 1%, respectively. |
| Variable | Morocco |
Turkey |
Egypt |
||||||
Coef. |
Std. error |
t-stat (Prob) |
Coef. |
Std. error |
t-stat (Prob) |
Coef. |
Std. error |
t-stat (Prob) |
|
| LvolREER | -1.27 |
0.52 |
-2.41* |
0.010 |
0.00 |
3.91*** |
14.38 |
8.49 |
1.69 |
| LvolInf | -0.54 |
0.08 |
-6.75*** |
-0.01 |
0.01 |
-8.61*** |
-0.10 |
0.47 |
-0.22 |
| GDP | 0.037 |
0.00 |
5.00*** |
-0.02 |
0.01 |
-1.80* |
-0.76 |
0.53 |
-1.42 |
| LGFCF | 2.40 |
0.29 |
8.19*** |
2.35 |
0.54 |
4.28*** |
0.42 |
0.13 |
3.08* |
| LOP | 0.57 |
0.13 |
4.19*** |
1.69 |
0.30 |
5.53*** |
0.09 |
0.14 |
0.64 |
| C | 5.88 |
3.51 |
1.67 |
3.12 |
0.86 |
3.62*** |
-69.48 |
47.02 |
-1.47 |
Note: In the case of Turkey, the volatility of inflation and the REER are not expressed in logarithm form. *** and * represent statistical significance at 1% and 10%, respectively |
Before interpreting the estimations obtained from the ARDL modeling, it is necessary to go through the tests allowing validation of the models, namely the bounds test, the serial correlation Lagrange multiplier (LM), the ARCH test of heteroscedasticity, and the functional form of the Ramsey and Jarque–Bera tests.
Table 10 exhibits the ARDL bounds test, which shows that there is cointegration between the variables specifying the models for Morocco, Turkey and Egypt. The value of the F-statistic is significantly higher at the upper and lower boundaries at the 1% level.
| Statistics tests | Morocco |
Turkey |
Egypt |
| Serial correlation « LM » | 0.006 (0.9380) |
0.052 (0.8234) |
2.63 (0.1484) |
| Heteroscedasticity « ARCH » | 2.077 (0.1619) |
1.15 (0.2919) |
0.002 (0.9624) |
| Functional form « Ramsey » | 0.0202 (0.9846) |
0.04 (0.9651) |
33.41 (0.0000) |
| Jarque–Bera | 1.,0302 (0.5974) |
0.7092 (0.7014) |
0.2064 (0.3562) |
Then, the serial correlation, ARCH heteroscedasticity and Jarque–Bera tests for the three countries were carried out and the results obtained allow us to accept the null hypotheses, which are the absence of correlation between the variables, homoscedasticity, and the normality of residuals, respectively.
On the other hand, the Ramsey test is positive for the Morocco and Turkey models, allowing the acceptance of the assumption that the models are well specified. For the Egypt model, this test is significant and therefore rejects the null hypothesis.
4.2. Results Discussion
As mentioned above, and following the results obtained and the model validity tests carried out for each country, it appears that the models obtained for Morocco and Turkey are significant and interpretable. On the other hand, the output model for Egypt doesn’t seem valid or significant.
Some countries (e.g., Russia, Gambia, China, Chad, Sierra Leone, and Egypt) have been suspected of, and others (such as Ukraine) have even been caught, misreporting data for the balance of payment accounts1 . Analysts in several cases have cast doubt on the veracity and accuracy of data from Egypt (2005) as well as many countries when the size of net errors and omissions can seriously alter the current account balance indicated by a country (Tomasz & Gilles, 2011).
Data in Egypt has been manipulated to meet performance criteria, affecting restructuring and privatization strategies, and altering the valuation of company’s public assets (Dieter & Ulrich, 1998).
In its presentation of the Human Development Report in Egypt, the National Planning Institute pointed out that there are huge problems even in the most basic indicators in Egypt (Egypt Government, 1994). The U.S. Agency for International Development's privatization plan reiterated that a large amount of current important data and information is not available.
This suggests a possible manipulation of macroeconomic statistics declared or published by the Egyptian authorities, and analysts have questioned the miraculous improvement from an inflation rate of 33% in 2018 to 4.3% in 2019 according to figures released by the Egyptian ministry.
All these elements justify the results obtained from the tests regarding the insignificance of the econometric model for Egypt. Therefore, interpretation of the output of this model is not feasible.
4.2.1. Short-run Estimation ARDL
The value of CointEq (-1) is -2.16 for Morocco and -1.50 for Turkey. These values reflect the degree to which the short-run dynamics deviate from the equilibrium in the long run. The significance at the 1% threshold and the negativity of the two coefficients obtained make it possible to judge the utility and feasibility of the short-term model and its interpretable results.
The socioeconomic crisis due to the Covid-19 pandemic seems to have a significant positive impact on inward FDI in Morocco and an insignificant impact in Turkey for 2020. According to the World Investment Report 2021 established by The United Nations Conference on Trade and Development, FDI inflows to Morocco remained almost unchanged at $1.8 billion in 2020. Morocco’s FDI profile is relatively diversified, with an established presence of some major MNEs in manufacturing industries, including automotive, aerospace and textiles. The long-term commitment of these firms to the country, coupled with steady inflows in mining of phosphate, means that Morocco holds the largest reserves and has mitigated against decreasing cross-border investment inflows despite the global crisis (United Nations Conference on Trade and Development, 2021).
In addition, among the sectors that benefited the most from FDI in 2020 are the manufacturing industries (+5.4 billion MAD or 32.5% of total FDI), real estate activities (+4.5 billion MAD or 26.9% of total) and financial and insurance activities (+2.5 billion MAD or 14.9% of the total). FDI coming from France, Spain and the United Arab Emirates recorded increases of +6 billion MAD, + 1.4 billion MAD and 0.9 billion MAD, respectively. These three countries captured 50.2% of the total net flow of foreign direct investment in Morocco in 2020 (Studies and Statistics Department, 2020).
The Moroccan authority has stood out for the way in which it has faced the social and economic repercussions of the Covid-19 pandemic compared to other countries in the region. This can be a good signal to foreign investors and increase their confidence in the Moroccan economic and social environments as a host country of FDI. During the pandemic, the Moroccan authorities adopted a number of measures to mitigate the impact of the pandemic’s social and economic repercussions on households and companies by issuing direct transfers to formal and informal workers and partial guarantees to banks for loans granted to firms, as well as reducing the Central Bank’s benchmark interest rate by 75 basis points to a historically low 1.5% and making direct injections of liquidity into the financial system (The World Bank). The government has also initiated an ambitious reform process, which could increase potential growth in the medium and long terms, such as the creation of the Mohammed VI Investment Fund and the new development model.
Nevertheless, it is important to note that foreign direct investment flows to Morocco have experienced a significant drop from $3,558.88 million in 2018 to $1,720.00 million in 2019. FDI inflows to North Africa decreased by 11% to $14 billion in 2019, unlike the world figures, which increased by almost 3%, with reduced inflows to all countries except Egypt (United Nations Conference on Trade and Development, 2020). Moroccan inward FDI has remained been below $2000 million since 2011.
Regarding Turkey, FDI inflows to this country showed a decrease of 15% to $7.9 billion in 2020 but picked up toward the end of the year ($2.3 billion in Q4) preventing a steeper decline. Major FDI deals in 2020 included a $200 million investment by Metric Capita (France) in a pharmaceuticals manufacturing unit and the Qatar Investment Authority's acquisition of a 10% equity stake in a stock exchange operator also valued at $200 million (United Nations Conference on Trade and Development, 2021).
According to the United Nations Conference on Trade and Development (2021), the Turkish policy interventions to diversify investment appear to be effective; key investments were reported in financial services, retail, e-commerce and ICT. Turkey has been actively facilitating FDI to support economic recovery and development and, in particular, extending its specialized free zone program that focuses on software and ICT activities to other high value add and technology-intensive activities. This measure encouraged Ford (United States) to build a $2.6 billion plant for commercial vehicle and battery assembly operations for electric vehicles in the Kocaeli industrial zone.
It should be noted that incoming FDI recorded a decrease in 2019 and 2020 of 28% and 15%, respectively. According to the World Investment Report, the decline of FDI flows to Turkey in 2019 can be explained by the slowdown triggered by global economic uncertainty as well as weak economic growth. Unlike other major economies in West Asia, which are rich in natural resources, Turkey's economy is more exposed to global macroeconomic conditions, which thus limited FDI flows in 2019 (United Nations Conference on Trade and Development, 2020).
In the short term, the volatility of the REER positively influences FDI in Morocco. The volatility of inflation negatively and significantly influences the entry of Foreign Direct Investment into Morocco at the first difference. However, a significant positive impact was found for inflation at the second difference for Turkey and Egypt and in the third difference for Morocco. On the other hand, economic growth shows a positive and significant impact on FDI inflows at the first and second differences for Morocco and at the second difference for Turkey. The results corresponding to the level of infrastructure show a significant positive impact on inward FDI at the first difference and a significantly negative impact at the second difference in Morocco. Economic openness attracts more foreign direct investment to Morocco. The results obtained at the first, second and third differences are significantly positive at the 1% level.
It should be noted that the gross fixed capital formation and the economic openness recorded during 2020 characterized by the Covid-19 crisis showed respective decreases of 9% and 15% in Morocco and 1% and 8% in Turkey (The World Bank). The Moroccan GDP decreased by 7.12% and the Turkish GDP increased by 1.7% (The World Bank). The volatility of the REER calculated for 2020 is less important than that for 2019 in Turkey. On the other hand, the Moroccan volatility of the REER remained at almost the same level in 2020 as in 2019 (Bruegel REER database and our calculations). Regarding inflation, Morocco and Turkey recorded respective figures of 0.706% and 12.279% (The World Bank).
4.2.2. Long-Run ARDL Estimation
- Real effective exchange rate volatility
According to the results of the long-run ARDL estimate, it appears that the volatility of the real effective exchange rate negatively influences the entry of foreign direct investment into Morocco with a coefficient of -1.27. This result remains insignificant at the 10% level. This non-significance can be explained by the exchange rate regime adopted by Morocco in a quasi-fixed mode with a limited flexibility margin of +/- 0.3%. In such a regime, the state reserves absorb exogenous shocks and the impact of exchange rate volatility. It should be remembered that it was not until 2018 that Morocco initiated its process of reforming the exchange rate regime by moving to a fluctuation range of +/- 2.5 and then to +/- 5% in March 2020. The negative sign can be explained by the predominance of a mode of FDI aimed at exporting production, an activity considered to be very sensitive to fluctuations in exchange rate. This type of FDI makes Morocco an industrial platform while taking advantage of the tax benefits offered and the qualified and less expensive workforce. In addition, it appears that the volatility of the exchange rate has a positive impact on incoming FDI in Turkey with a very significant coefficient of 2 (0.010 expressed in logarithm form). The link between FDI and exchange rate uncertainty is ambiguous insofar as exchange rate volatility can both encourage and discourage foreign investment (Aizenman, 1992; Cushman, 1988; Kulatilaka & Kogut, 1996). However, several authors have shown that the volatility of the exchange rate generates an increase in inward FDI (Cushman, 1985; Cushman, 1988; Goldberg & Kolstad, 1995; Takagi & Shi, 2011). Furthermore, among the findings from the benchmark carried out by Bank Al-Maghrib as part of its preliminary study before relaunching itself in the process of gradual liberalization, is that Turkey contradicts its adoption of a flexible exchange rate regime as its central bank continues to keep an eye on the float of the Turkish Lira while intervening to mitigate exchange rate fluctuations whenever they are deemed excessive and hence have a rather administered floating exchange rate regime.
- Economic growth
Economic growth has a significantly positive effect on the entry of foreign direct investment into Morocco. On the other hand, the results show that the increase in economic growth led to a decrease in FDI inflow in Turkey. However, this result remains insignificant at the 5% level. This can be explained by the epistemological break between the Turkish economy before and after 2002 characterized by sustained economic growth accompanied by disinflation.
- Inflation Volatility, Infrastructure and Economic Openness
The volatility of inflation, infrastructure and economic openness has the same strongly significant effects on foreign direct investment in Morocco as in Turkey. According to the results obtained, the volatility of increased inflation limits inward FDI. Nevertheless, FDI is more elastic to the volatility of inflation in Turkey than in Morocco, with -2.0045 (-0.01 expressed in logarithm) and -0.53738, respectively. Turkey's economy has suffered from macroeconomic instability manifested by high and chronic inflation rates. For the period from 1990 to 2002, the average annual inflation rate was 71%. The ceiling was reached in 1994 with an inflation rate of 105%. On the other hand, Morocco recorded 7.98% in 1991, which was the highest inflation rate between 1990 and 2020, and the average inflation rate for the period from 1996 to 2020 was around 1.58% (source: The World Bank).
The level of infrastructure attracts foreign direct investment to Morocco and Turkey. According to Blonigen (2005), the quality of institutions and infrastructure also affects FDI decisions regarding location, particularly in developing countries. The quality of the infrastructure is considered a fundamental factor in attracting FDI (Michalet, 1999). The continuous improvement of a country's infrastructure allows its territory to be valued, especially compared to competing countries, and therefore attracts more FDI. According to World Bank figures, Morocco and Turkey committed gross domestic investments of $662,37 and $5,689.78 billion, respectively, between 1990 and 2020 (constant 2010 US$). Around 50% of these investments were made between 2009 and 2020 and almost 80% between 2001 and 2020. This indicates the importance attributed more and more in recent years to this determining factor of FDI (source: The World Bank and UNITAD STAT). Economic openness measured by the sum of exports and imports to the rest of the world seems to have a strongly significant positive effect on FDI. Dupuch & Milan (2002)and Kinoshita & Campos (2003) have shown that the level of GDP, domestic investment and the degree of openness are determinants of foreign direct investment. Between 1990 and 2020, the sums of trade in goods and services carried out by Morocco and Turkey with the rest of the world are almost $1,7489.91 and $9,507.91 billion, respectively, (constant 2010 US$) (source: The World Bank and UNICTAD STAT).
Regarding the quality of infrastructure or economic openness, the results show that these two variables have a more interesting positive impact in Turkey than in Morocco.
5. Conclusion
Through a comparative study between Morocco, Turkey and Egypt, this paper aimed to examine and analyze the impact of real effective exchange rate and the Covid-19 pandemic on foreign direct investment inflows. To achieve this, we used a data on economic growth, gross fixed capital formation, economic openness, inflation volatility, REER volatility, and the Covid-19 pandemic as a dummy variable, taking only the value of 0 or 1 to indicate the absence or presence of pandemic. The data were collected from the World Bank, the United Nations Conference on Trade and Development, and Bruegel REER database covering the period from 1990 to 2020. The results obtained from the autoregressive distributed lag model show that gross fixed capital formation and economic openness significantly influence FDI flows into Morocco and Turkey, unlike inflation volatility, which is negatively correlated with FDI inflows. In Morocco, GDP growth favors FDI inflow, while Turkey’s estimation highlights a negative impact at the 10% level.
The REER volatility’s estimations show a negative impact at 10% and a positive impact at the 1% level in Morocco and Turkey, respectively, knowing that Turkey has opted for a floating exchange rate regime since 2001/2002. On the other hand, the Covid-19 pandemic does not seem to have had a significant negative impact on FDI flows to Morocco, and it had a non-significant impact in Turkey. The world FDI inflows have suffered from a long-term downtrend since the 2008 financial crisis, and the slowdown caused by Covid-19 exacerbates this downtrend. Based on previous studies and the results obtained from this study, we can conclude that the exchange regime mode isn’t an absolute criterion to decide whether it positively or negatively impacts the entry of FDI; there are other factors that limit, exacerbate or reorganize this influence (geopolitics, socioeconomics, etc.). Furthermore, despite the economic repercussions due to the Covid-19 pandemic, some countries saw their FDI inflows augmented, and others stayed on the same downtrend, which highlights this health crisis as having a slowing influence on inward FDI and is not the only cause of the World FDI drop recorded in 2020. However, this study suffers from certain limitations that must be cited. The study period (1990–2020) poses a problem of data unavailability and international economic and political indicators concerning the three countries. The inclusion of these indicators, which appeared at the beginning of the 2000s and others after the 2008 crisis, would certainly have enriched the results and the conclusions of our study; however, the number of observations were limited and this may have caused bias in the estimates obtained. In addition, the political factor remains an important element in such a study as this, especially because some economists, such as Thomas Piketty and Joseph E. Stiglitz, pointed out that it is not possible to separate the economic factor from the political factor.
References
Abel, A. B. (1983). Optimal investment under uncertainty. The American Economic Review, 73(1), 228-233.
Aizenman, J. (1992). Exchange rate flexibility, volatility, and domestic and foreign direct investment. Palgrave Macmillan Journals, 39(4), 890-922.
Baek, I.-M., & Okawa, T. (2001). Foreign exchange rates and Japanese foreign direct investment in Asia. Journal of Economics and Business, 53(1), 69-84.
Barrell, R., & Pain, N. (1996). An econometric analysis of U.S. Foreign direct investment. The Review of Economics and Statistics, 78(2), 200-207.
Bayoumi, T., & Lipworth, G. (1998). Japanese foreign direct investment and regional trade. Journal of Asian Economics, 9(4), 581-607.Available at: https://doi.org/10.1016/s1049-0078(98)90064-1.
Bénassy-Quéré, A., Fontagné, L., & Lahrèche-Révil, A. (2001). Exchange-rate strategies in the competition for attracting foreign direct investment. Journal of the Japanese and International Economies, 15(2), 178-198.Available at: https://doi.org/10.1006/jjie.2001.0472.
Blonigen, B. A. (2005). A review of the empirical literature on FDI determinants. Atlantic Economic Journal, 33(4), 383-403.Available at: https://doi.org/10.1007/s11293-005-2868-9.
Campa, J. (1993). Entry by foreign firms in the United States under exchange rate uncertainty. Review of Economics & Statistics, 75(4), 614-622.Available at: https://doi.org/10.2307/2110014.
Caves, R. E. (1982). Multinational enterprise and economic analysis. Cambridge: Cambridge University Press.
Cushman, D. O. (1985). Real exchange rate risk, expectations, and the level of direct investment. The Review of Economics and Statistics, 67(2), 297-308.Available at: https://doi.org/10.2307/1924729.
Cushman., D. O. (1988). Exchange-rate uncertainty and foreign direct investment in the United States. Weltwirtschaftliches Archiv, 124(2), 322-336.Available at: https://doi.org/10.1007/bf02706782.
Dees, S. (1998). Foreign direct investment in China: Determinants and effects. Economics of Planning, 31(2), 175-194.
Dieter, W., & Ulrich, W. (1998). The economics and politics of transition to an open market economy. Retrieved from https://oecd-ilibrary.org.
Dixit, & Pindyck. (1994). Numerical solution of the sequential investment model. The European Journal of Finance, 16(8), 743-752.
Dixit, A. (1989). Entry and exit decisions under uncertainty. Journal of Political Economy, 97(3), 620-638.Available at: https://doi.org/10.1086/261619.
Dornean, A., Isan, V., & Oanea, D. C. (2012). The impact of the recent global crisis on foreign direct Investment. Evidence from central and Eastern European countries. Procedia Economics and Finance, 3, 1012 – 1017.Available at: https://doi.org/10.1016/s2212-5671(12)00266-3.
Dupuch, S., & Milan, C. (2002). The determinants of European foreign direct investment in the countries of central and Eastern Europe. Working Paper No. 2003-07.
Egypt Government. (1994). Egypt: Human development report 1994. Cairo: Ministry of Planning, Institute of National Planning.
Fang, J., Collins, A., & Yao, S. (2021). On the global COVID-19 pandemic and China’s FDI. Journal of Asian Economics, 74, 101300.Available at: https://doi.org/10.1016/j.asieco.2021.101300.
Ferrara, L., & Henriot, A. (2004). The location of industrial companies: How to assess the attractiveness of territories. International Economy(99), 91-111.Available at: https://doi.org/10.3917/ecoi.099.0091.
Froot, K., & Stein, J. (1991). Exchange rates and foreign direct investment: An imperfect capital market. Quarterly Journal of Economics, 106(4), 1191-1217.Available at: https://doi.org/10.2307/2937961.
Globerman, S., & Shapiro, D. M. (1999). The impact of government policies on foreign direct investment: The Canadian experience. Journal of International Business Studies, 30(3), 513-532.Available at: https://doi.org/10.1057/palgrave.jibs.8490081.
Goldberg, L., & Kolstad, C. (1995). Foreign direct investment, exchange rate variability and demand uncertainty. International Economic Review, 36(4), 855-873.Available at: https://doi.org/10.2307/2527262.
Hartman, R. (1972). The effects of price and cost uncertainty on investment. Journal of Economic Theory, 5(2), 258-266.Available at: https://doi.org/10.1016/0022-0531(72)90105-6.
Ito, T. (2000). Capital flows in Asia capital flows and the emerging economies (pp. 255-296). Chicago, IL: The University of Chicago Press.
Kinoshita, Y., & Campos, N. F. (2003). Why does FDI go where it goes? New evidence from the transition economies. Working Paper No. 573. Retrieved from: https://doi.org/10.2139/ssrn.414540.
Kiyota, K., & Urata, S. (2004). Exchange rate, exchange rate volatility and foreign direct investment. World Economy, 27(10), 1501-1536.Available at: https://doi.org/10.1111/j.1467-9701.2004.00664.x.
Klein, M. W., & Rosengren, E. (1994). The real exchange rate and foreign direct investment in the United States: Relative wealth vs. relative wage effects. Journal of International Economics, 36(3-4), 373-389.Available at: https://doi.org/10.1016/0022-1996(94)90009-4.
Kulatilaka, N., & Kogut, B. (1996). Direct investment, hysteresis, and real exchange rate volatility. Journal of the Japanese and International Economies, 10(1), 12-36.Available at: https://doi.org/10.1006/jjie.1996.0002.
Liu, W. H. (2010). Determinants of FDI inflows to China: An empirical analysis of source country characteristics. Paper presented at the Taipei International Conference on Growth, Trade and Dynamics.
Lucas, R. E. (1967). Adjustment costs and the theory of supply. Journal of Political Economy, 75(4), 321-334.Available at: https://doi.org/10.1086/259289.
Michalet, C. A. (1999). The seduction of nations or how to attract investments. Economica Paris, 30, 72-82.
Mucchielli, J. (1998). Multinationals and globalization. Paris: Editions Du Seuil.
Nguyen, A. T., & Cieślik, A. (2021). Determinants of foreign direct investment from Europe to Asia. The World Economy, 44(6), 1842-1858.Available at: https://doi.org/10.1111/twec.13064.
Nickell, S. (1974). On the role of expectations in the pure theory of investment. The Review of Economic Studies, 41(1), 1-19.Available at: https://doi.org/10.2307/2296395.
Pečarić, M., Kusanović, T., & Jakovac, P. (2021). The determinants of FDI sectoral structure in the central and East European EU countries. Economies, 9(2), 1-16.Available at: https://doi.org/10.3390/economies9020066.
Pesaran, M. H., & Shin, Y. (1999). An autoregressive distributed lag modelling approach to cointegration analysis. In Strom, S. (Ed.): Econometrics and Economic Theory in 20th Century: The Ragnar Frisch Centennial Symposium, Chapter 11 (pp. 1-31). Cambridge: Cambridge University Press.
Pesaran, M. H., Shin, Y., & Smith, R. J. (2001). Bounds testing approaches to the analysis of level relationships. Journal of Applied Econometrics, 16(3), 289-326.Available at: https://doi.org/10.1002/jae.616.
Sazanami, Y., Yoshimura, S., & Kiyota, K. (2003). Japanese foreign direct investment to East Asia and exchange rate policies: Some longer term policy implications after the crisis. Keio Economic Studies, 40(1), 1-26.
Sazanami, Y., & Wong, Y. C. (1997). Strategies of Japanese multinationals: Changes in the locational importance of Asia, the EC and North America. In P. J. Buckley and J.-L. Mucchielli (Eds.), Multinational Firms and International Relocation (pp. 103–122). Cheltenham, UK: Edward Elgar.
Sridharan, P., Vijayakumar, N., & Rao, K. C. S. (2010). Determinants of FDI in BRICS countries: A panel analysis. International Journal of Business Science and Applied Management, 5(3), 1–13.
Studies and Statistics Department. (2020). Annual report balance of payments and overall external position of Morocco (pp. 85). Morocco: Exchange Office.
Takagi, S., & Shi, Z. (2011). Exchange rate movements and foreign direct investment (FDI): Japanese investment in Asia, 1987–2008. Japan and the World Economy, 23(4), 265-272.Available at: https://doi.org/10.1016/j.japwor.2011.08.001.
Thomas, D. E., & Grosse, R. (2001). Country-of-origin determinants of foreign direct investment in an emerging market: The case of Mexico. Journal of International Management, 7(1), 59-79.Available at: https://doi.org/10.1016/s1075-4253(00)00040-5.
Tomasz, M., & Gilles, S. (2011). Do countries falsify economic data strategically? Some evidence that they might. Hal Archives-ouvertes. Retrieved from https://halshs.archives-ouvertes.fr/halshs-00482106v3/document.
United Nations Conference on Trade and Development. (2020). World investment report, investing in sustainable recovery. UNCTAD. 280. Retrieved from: https://unctad.org.
United Nations Conference on Trade and Development. (2021). World investment report, international production beyond the pandemic. UNCTAD. 268. Retrieved from: https://unctad.org.
Urata, S., & Kawai, H. (2000). The determinants of the location of foreign direct investment by Japanese small and medium-sized enterprises. Small Business Economics, 15(2), 79-103.
Warren, M., Seetanah, B., & Sookia, N. (2021). Impact of exchange rate and exchange rate volatility on foreign direct investment inflow for Mauritius: A dynamic time series approach. African Development Review, 33(4), 581-591.Available at: https://doi.org/10.1111/1467-8268.12596.
Xia, X., & Liu, W.-H. (2021). China’s investments in Germany and the impact of the COVID-19 pandemic. Intereconomics, 56(2), 113-119.Available at: https://doi.org/10.1007/s10272-021-0962-0.
Footnotes:
1. According to Tomasz & Gilles (2011), it’s also the case for Russia (Financial Times, 1999), and for China (Financial Times, 2003). For Chad, Gambia and Sierra Leone, see the IMF press releases from 2003, 2005 and 2006, respectively. Doubts about Egypt’s figures are contained in Reuters News (2005).